How do I read survey results?
Results live at Surveys → (campaign) → Results, across five tabs. They are available on open campaigns too — subject to the same thresholds.
Overview
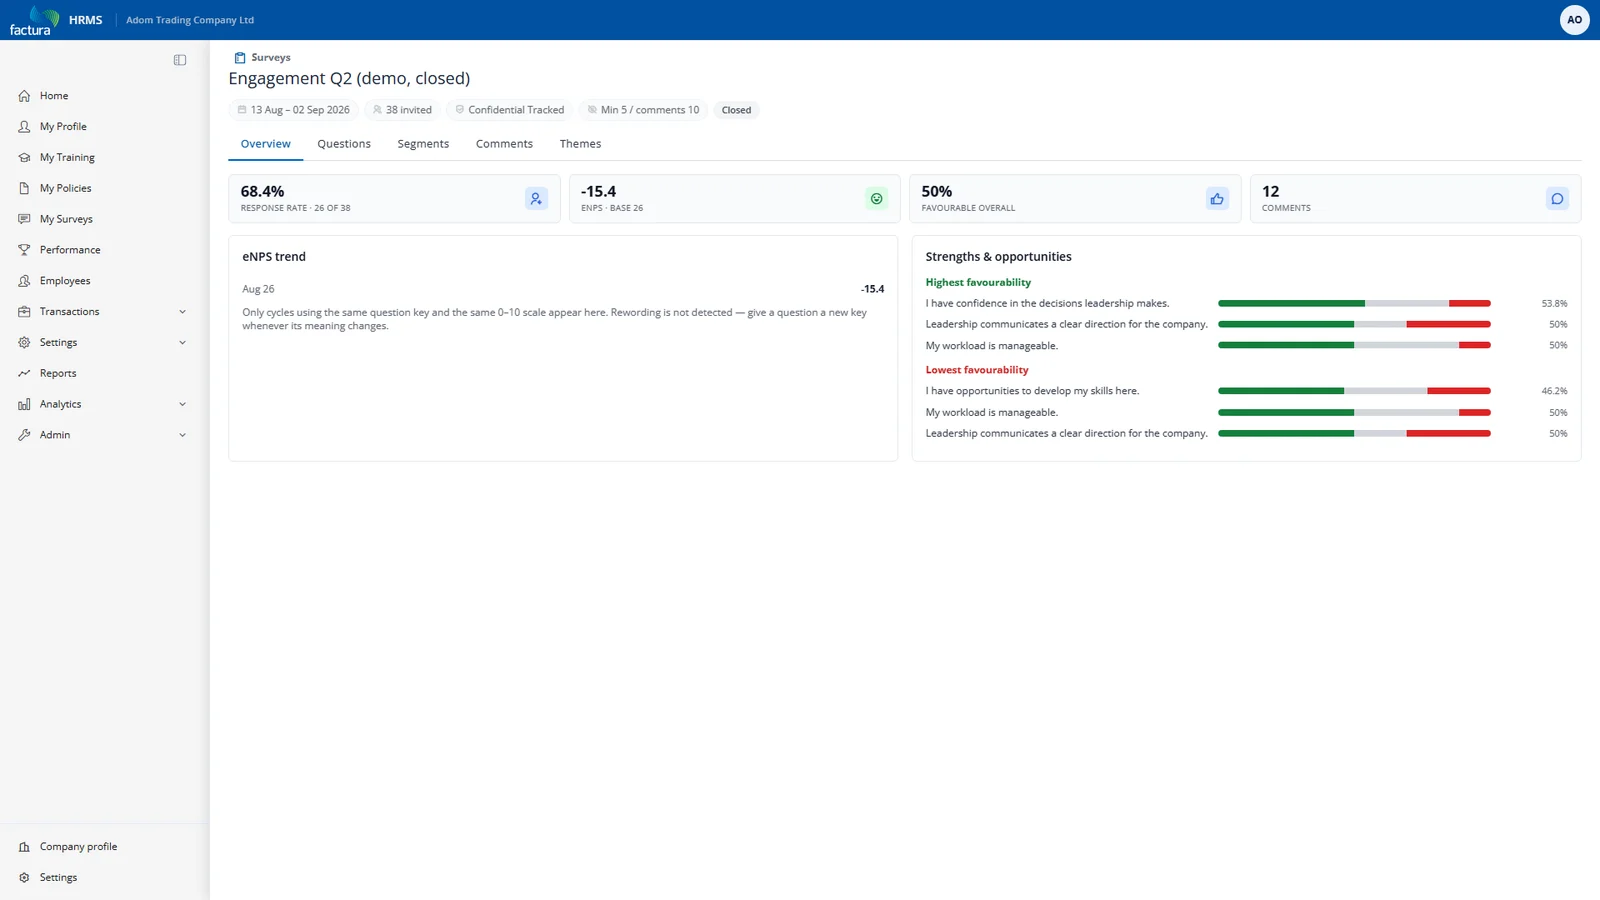
- Response rate — completed ÷ invited.
- eNPS — promoters minus detractors, with the base count it was computed from.
- Favourable overall — the share of scored answers in the favourable range.
- Comments — how many written answers came in.
- eNPS trend — earlier campaigns of the same survey, matched on question key and scale.
- Strengths & opportunities — the highest- and lowest-scoring questions.
Questions
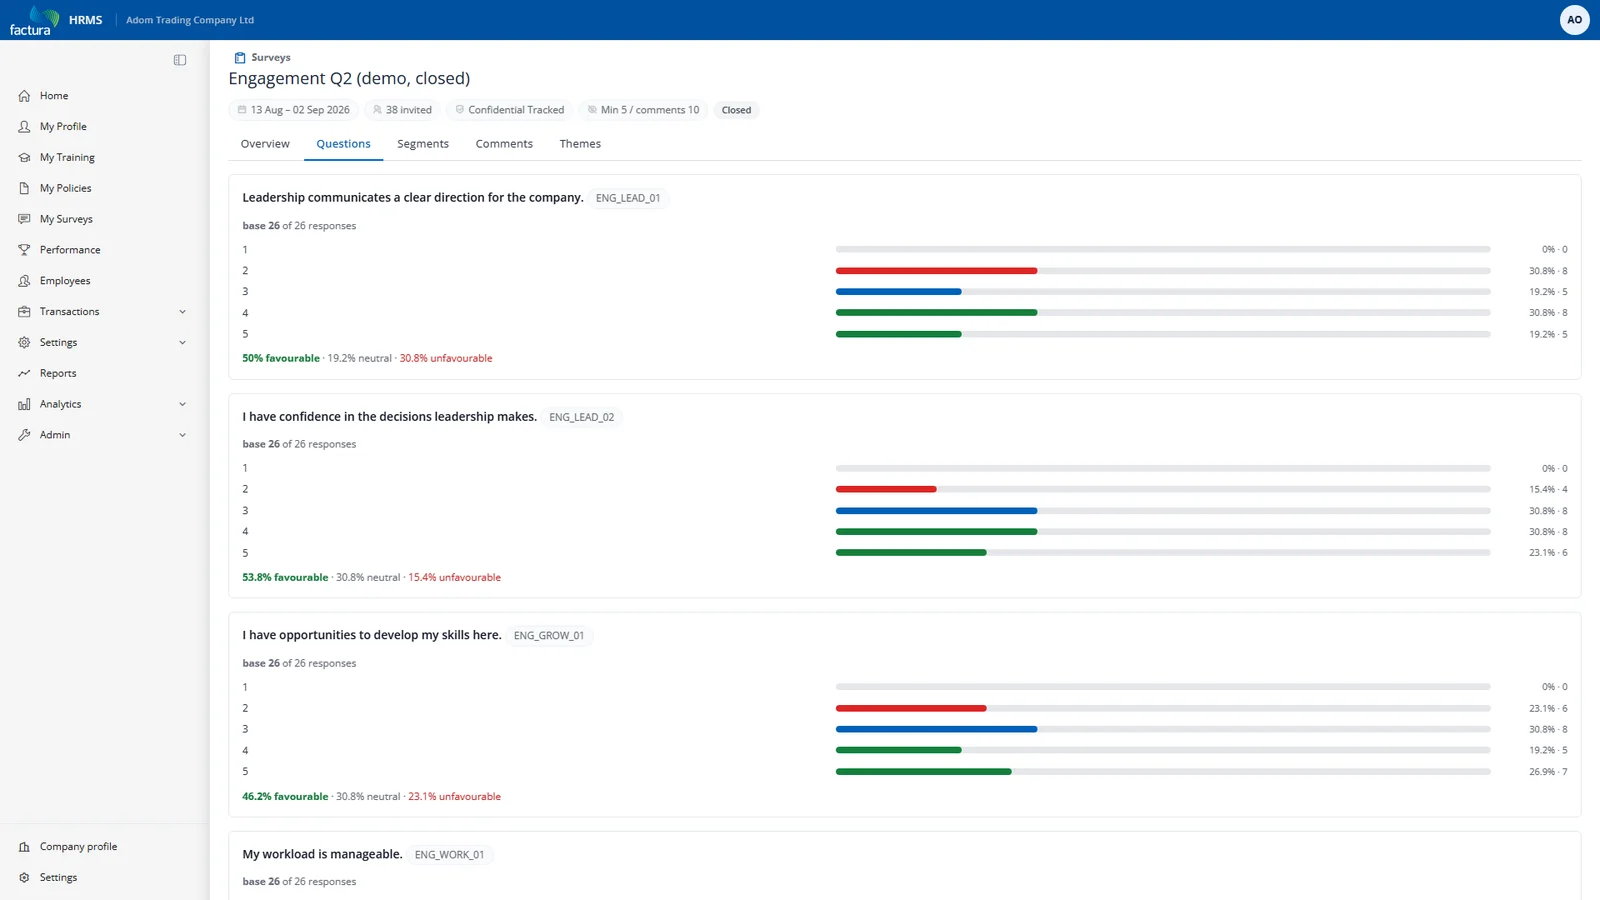
Every question with its favourability, its distribution, and its base count — the number of respondents behind the number. Always read the base. A 90% favourable score on a base of 6 is a very different fact from the same score on a base of 300.
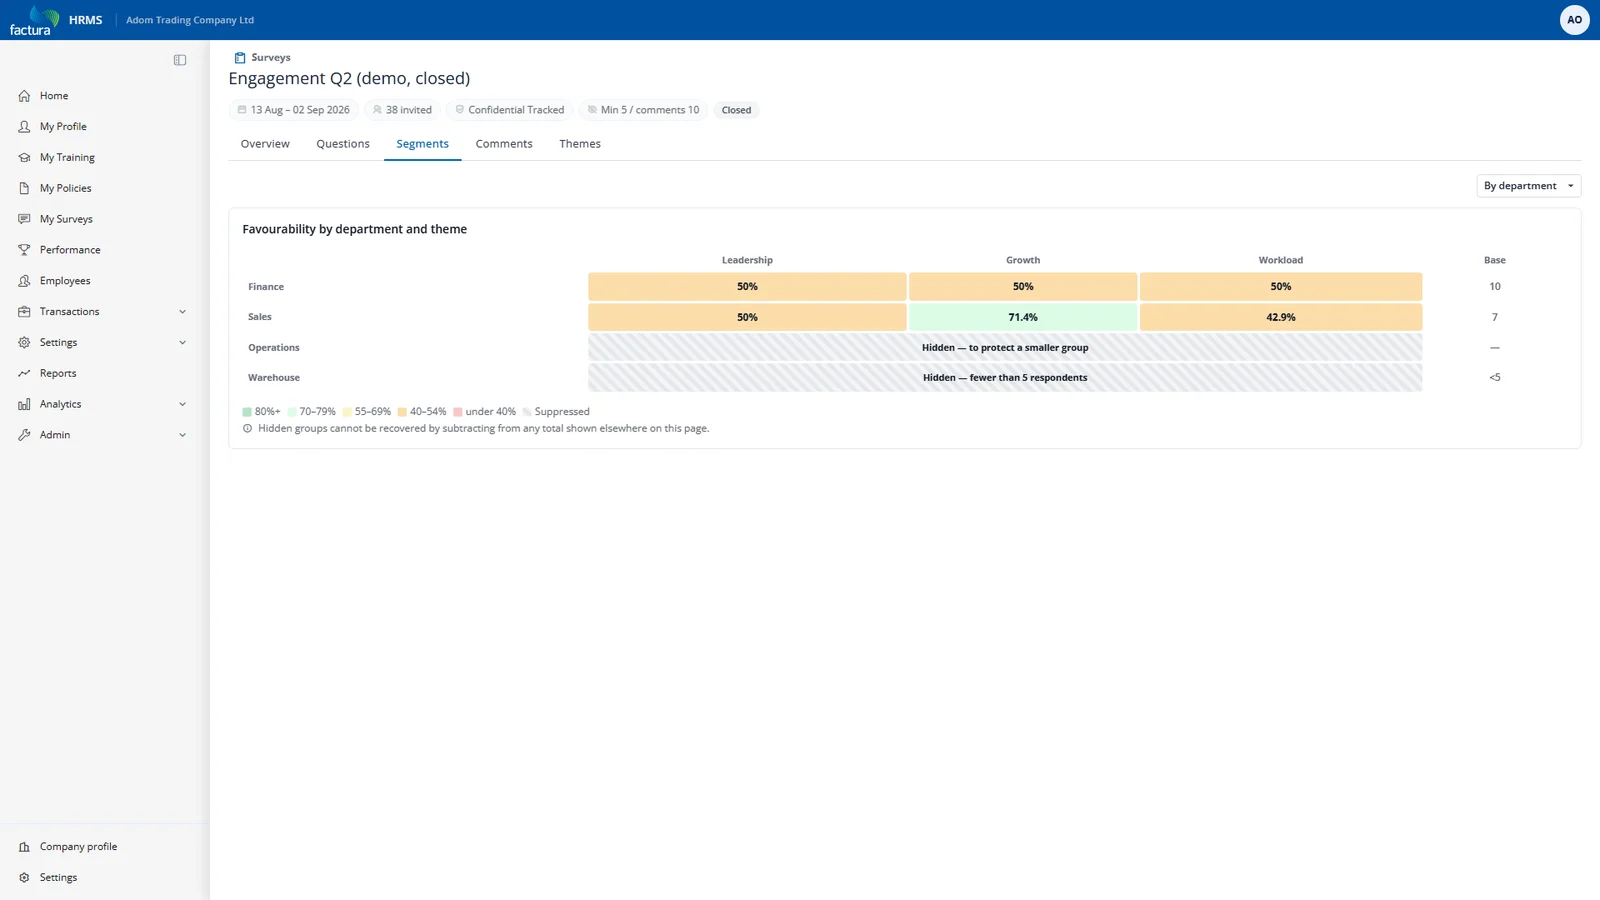
Segments
Favourability broken down by department, location or tenure band — as a heatmap, one row per group.